
Technical Analysis with Python & Ploty: Moving Averages

Introduction
Technical analysis involves evaluating financial assets based on historical price and volume data. This post will demonstrate how to perform basic technical analysis using python, yfinance for data retrieval, and plotly for data visualization.
Setting Up the Environment
First, ensure you have Python installed along with the necessary libraries. You can install the required packages using the following command:
pip install yfinance plotlyyfinance library to download historical stock data. For this example, let’s analyze the stock data for a company (BRIS.JK)import yfinance as yf import pandas as pd
# Download stock data for BRIS.JK from Yahoo Finance
df = yf.download("BRIS.JK", start="2022-05-22", end="2024-05-22")
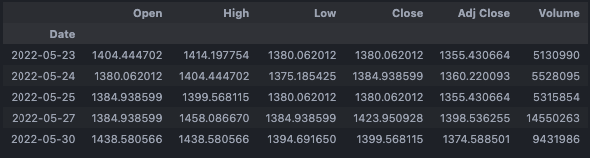
# Display the first few rows of the dataframe to understand its structure
print(df.head())The yfinance library is a popular tool for downloading historical market data from Yahoo Finance. The yf.download function fetches the data for a specified ticker symbol and date range, and returns it as a Pandas DataFrame. A Pandas DataFrame is a powerful data structure that allows easy manipulation and analysis of the data.
Creating a Candlestick Chart
A candlestick chart is a popular way to visualize stock data. Here’s how to create one using Plotly:
import plotly.graph_objects as go
# Create the candlestick chart
fig = go.Figure(data=[go.Candlestick(
    x=df.index, # Dates for the x-axis
    open=df['Open'], # Opening prices
    high=df['High'], # Highest prices
    low=df['Low'], # Lowest prices
   close=df['Close'] # Closing prices
)])

# Update the layout of the chart
fig.update_layout( title='BRIS.JK Stock Candlestick Chart', xaxis_title='Date', yaxis_title='Price (IDR)', autosize=True, height=600)
# Display the chart
fig.show()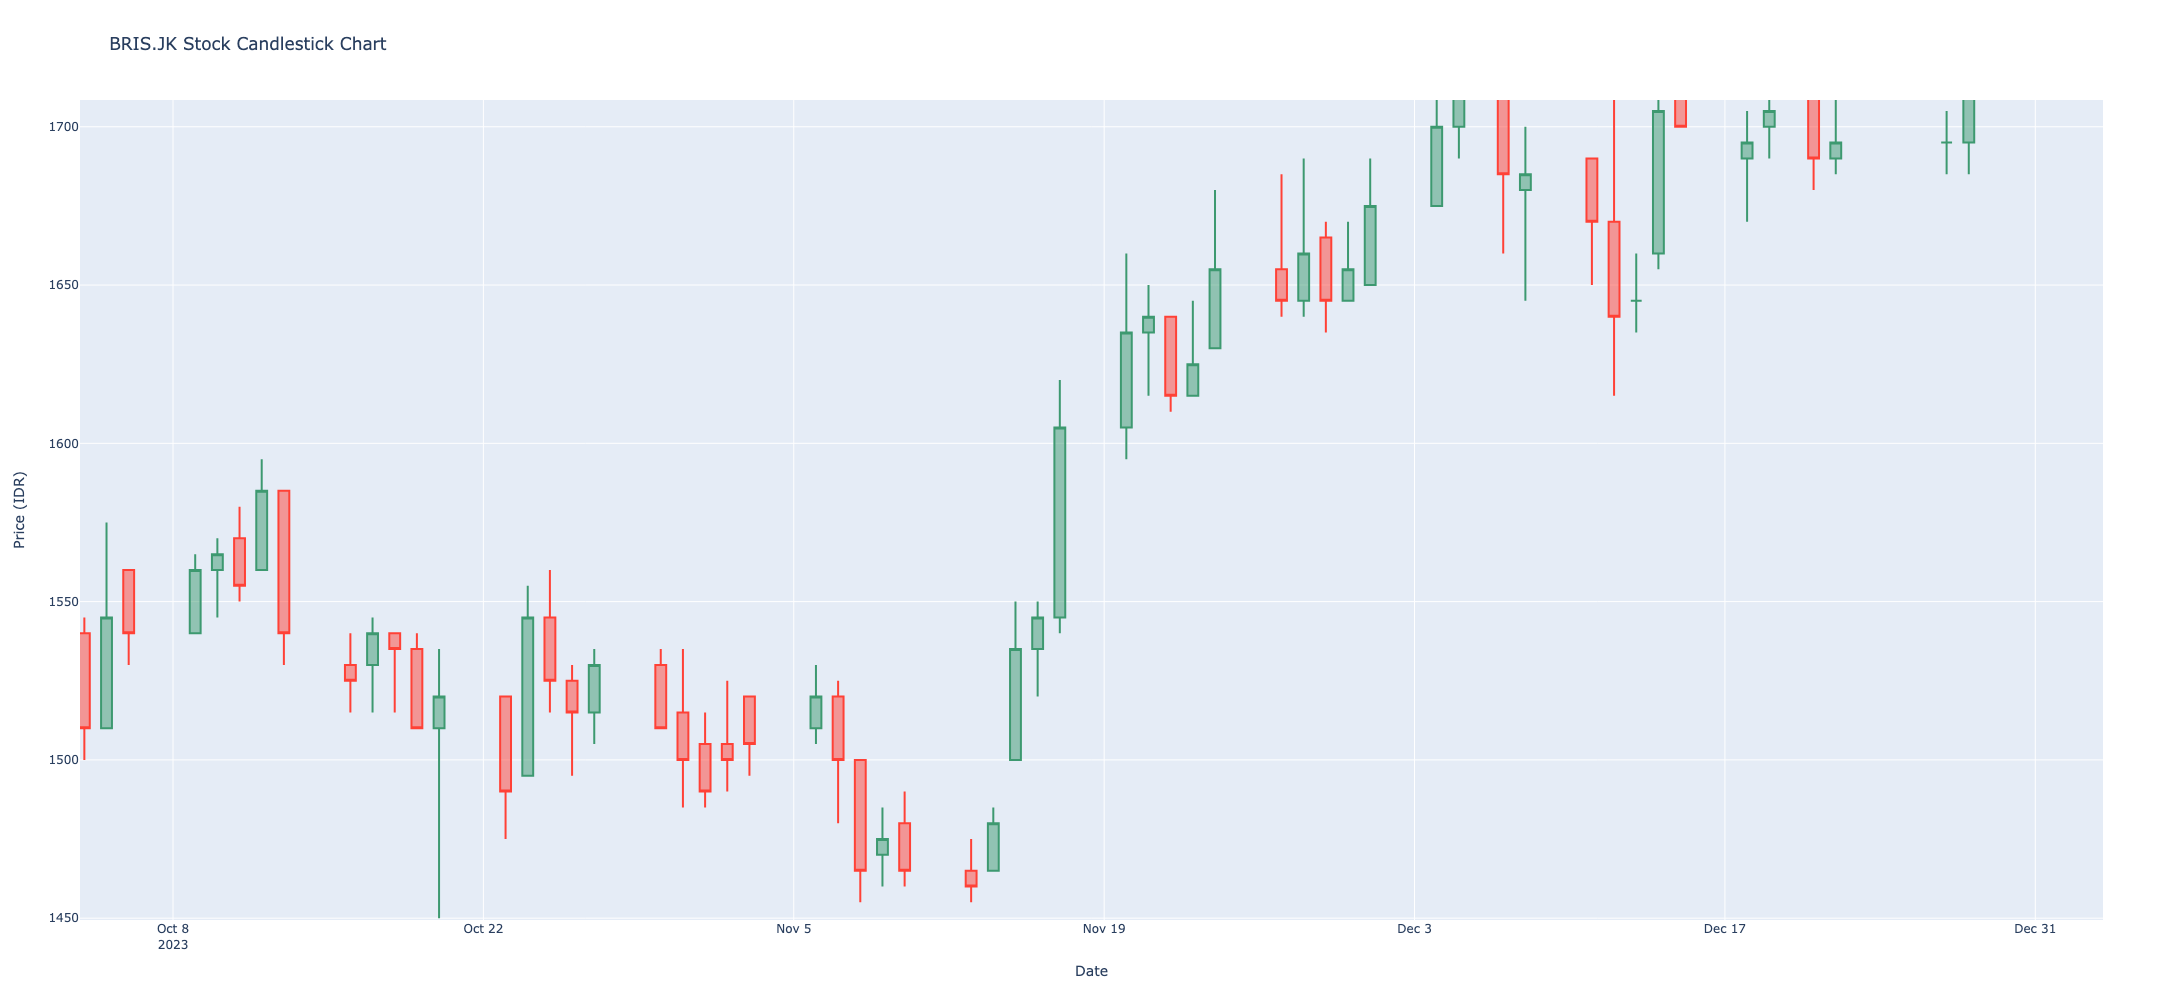
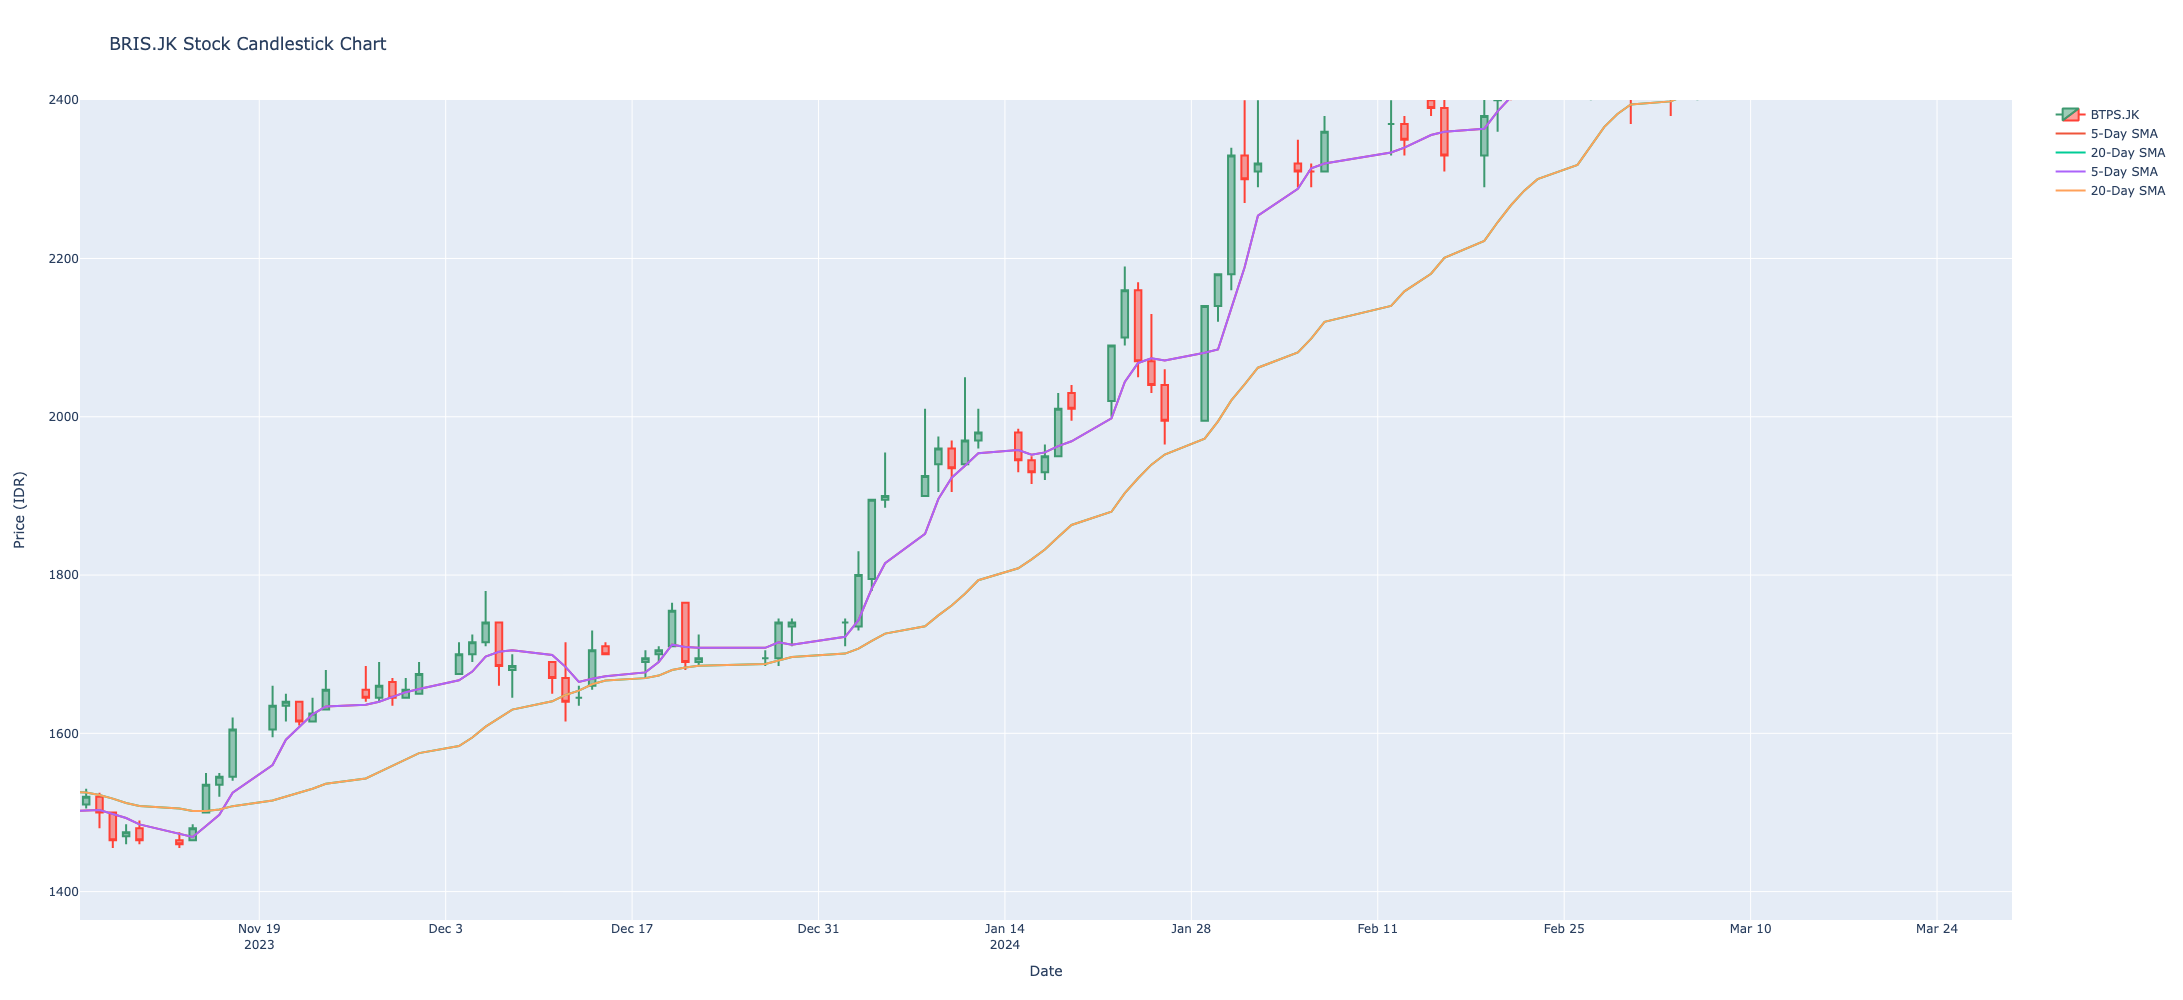
Adding Technical Indicators
To enhance our analysis, we can add technical indicators like moving averages. Here’s how to add the 5-day (SMA5) and 20-day (SMA20) Simple Moving Averages:
# Calculate the 5-day and 20-day SMAs
df['SMA5'] = df['Close'].rolling(window=5).mean()
df['SMA20'] = df['Close'].rolling(window=20).mean()

# Add the SMAs to the chart
fig.add_trace(go.Scatter(x=df.index, y=df['SMA5'], mode='lines', name='5-Day SMA'))
fig.add_trace(go.Scatter(x=df.index, y=df['SMA20'], mode='lines', name='20-Day SMA'))

# Display the updated chart
fig.show()
We can identify potential buy / sell signals based on the crossover of SMA5 and SMA20.
Specifically, we can buy the stocks when the fast moving average (5-day SMA) crosses up the slow moving average (20-day SMA), and we can sell the stocks when the 5-day SMA crosses down the 20-day SMA.
# Highlight the buy signals
cross_buy = df[(df['SMA5'] > df['SMA20']) & (df['SMA5'].shift(1) <= df['SMA20'].shift(1))]

fig.add_trace(go.Scatter(
    x=cross_buy.index,
    y=cross_buy['Low'] - 75,  # Move marker to bottom with padding
    mode='markers+text',
    marker=dict(color='green', size=10, symbol='triangle-up'),
    text=["Buy Here"] * len(cross_buy),  # Add text annotations
    textposition="bottom center",
    textfont=dict(size=12),
    name='Buy Signal'
))

# Highlight the sell signals
cross_sell = df[(df['SMA5'] < df['SMA20']) & (df['SMA5'].shift(1) >= df['SMA20'].shift(1))]

fig.add_trace(go.Scatter(
    x=cross_sell.index,
    y=cross_sell['High'] + 75,  # Move marker to top with padding
    mode='markers+text',
    marker=dict(color='red', size=10, symbol='triangle-down'),
    text=["Sell Here"] * len(cross_sell),  # Add text annotations
    textposition="top center",
    textfont=dict(size=12),
    name='Sell Signal'
))

# Update the layout with the new traces
fig.update_layout(
    title='BRIS.JK Stock Candlestick Chart with 5 and 20-Day SMA Buy/Sell Signals',
    xaxis_title='Date',
    yaxis_title='Price (IDR)',
    autosize=True,
    height=800,
)

# Show the chart with buy signals
fig.show()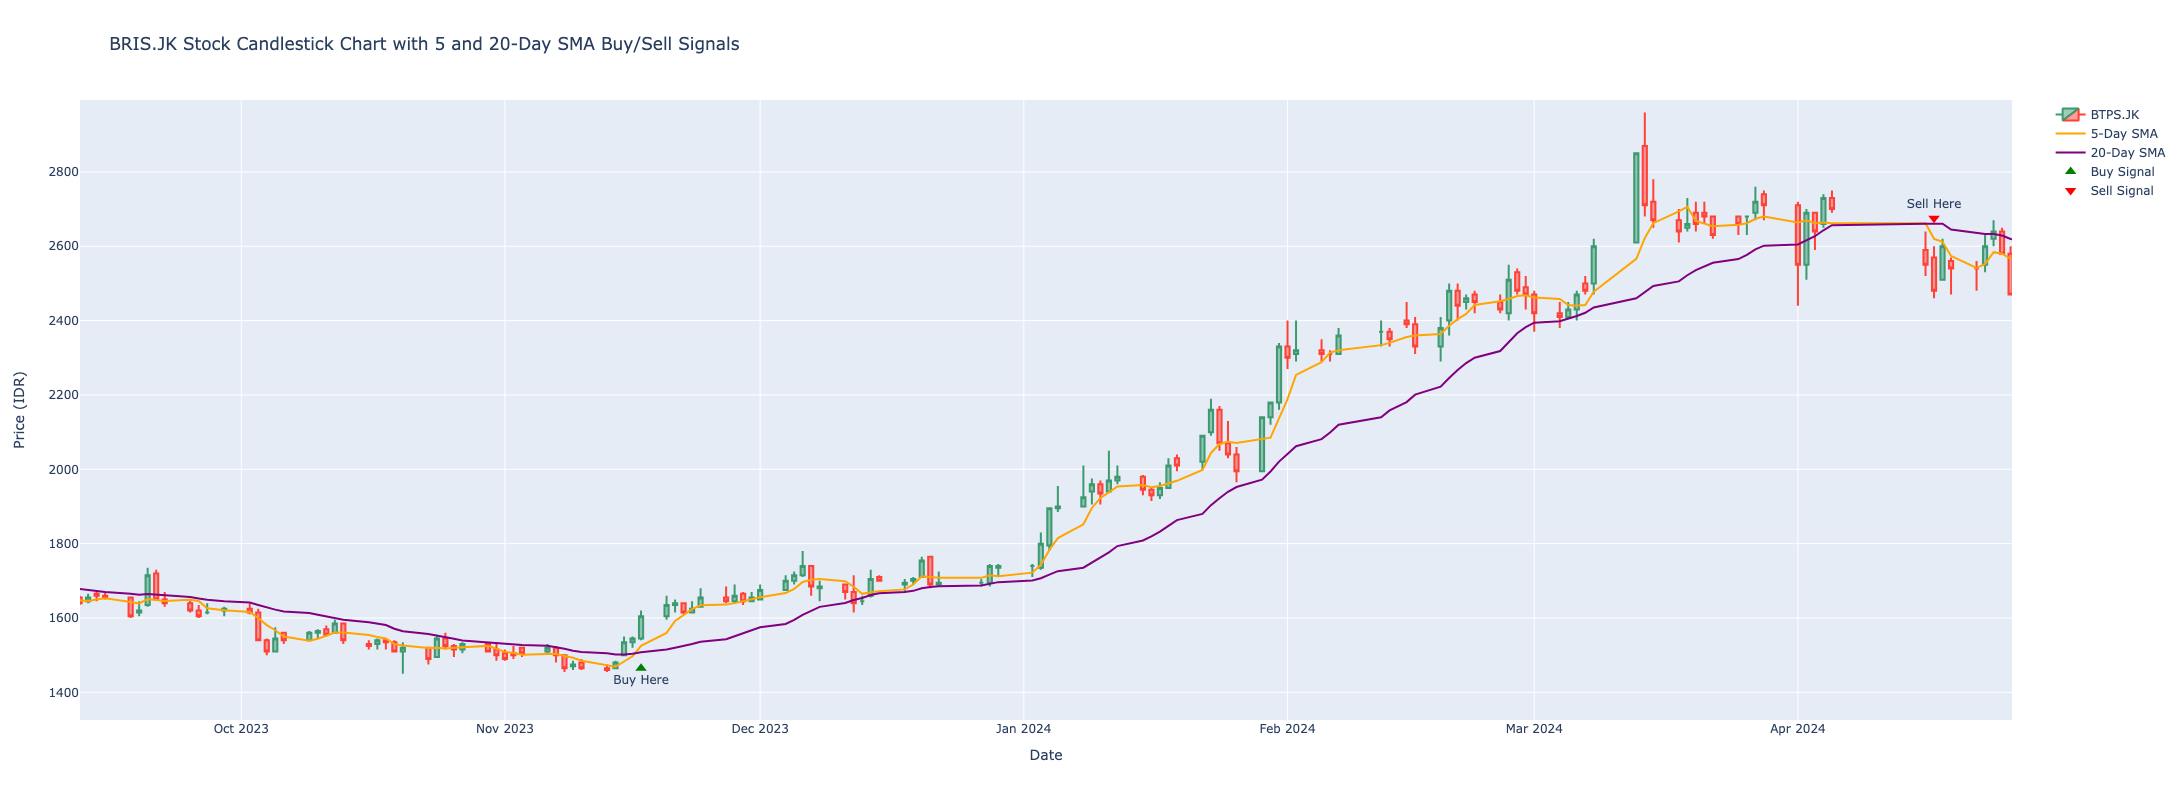
Conclusion
In this blog post, we demonstrated how to perform basic technical analysis using Python, yfinance, and Plotly. We downloaded historical stock data, created a candlestick chart, added simple moving averages, and identified buy and sell signals based on SMA crossovers. Specifically, we focused on the strategy of buying stocks when the 5-day SMA crosses above the 20-day SMA and selling when it crosses below.
These techniques can be extended with additional technical indicators to further analyze stock performance. Feel free to experiment with different stocks, time periods, and technical indicators to enhance your analysis. Happy analyzing!
Comments