
PineScript 5: Creating an Oversold / Overbought Indicator

Traditionally, an RSI reading of 70 or above indicates an overbought situation. A reading of 30 or below indicates an oversold condition.
// This Pine Script™ code is subject to the terms of the Mozilla Public License 2.0 at https://mozilla.org/MPL/2.0/
// © nsulistiyawan
//@version=5

indicator("RSI Overbought", overlay = true)
rsiValue = ta.rsi(close, 14)

isOverSold = rsiValue <= 30
isOverBought = rsiValue >= 70

plotshape(isOverBought, 'RSI Overbought', location=location.abovebar, color=color.red, style=shape.triangledown, text= "OB", textcolor = color.red, size = size.tiny)
plotshape(isOverSold, 'RSI Oversold', location=location.belowbar, color=color.green, style=shape.triangleup, text="OS", textcolor = color.green, size = size.tiny)
Explanation:
indicator("RSI Overbought", overlay = true): This line initializes the Pine Script indicator with the name "RSI Overbought" and sets it to overlay on the price chart.rsiValue = ta.rsi(close, 14): This line calculates the RSI (Relative Strength Index) value using a 14-period lookback period. The RSI measures the magnitude of recent price changes to evaluate overbought or oversold conditions.isOverSold = rsiValue <= 30andisOverBought = rsiValue >= 70: These lines define boolean variablesisOverSoldandisOverBoughtbased on whether the RSI value is less than or equal to 30 (oversold condition) or greater than or equal to 70 (overbought condition), respectively.plotshape(): This function plots shapes on the chart based on specified conditions. In this case, it plots downward-pointing triangles (shape.triangledown) in red color above the price bars for overbought conditions, and upward-pointing triangles (shape.triangleup) in green color below the price bars for oversold conditions. Thetextparameter adds text labels "OB" and "OS" respectively to indicate overbought and oversold conditions, with corresponding text colors and sizes.
Results:
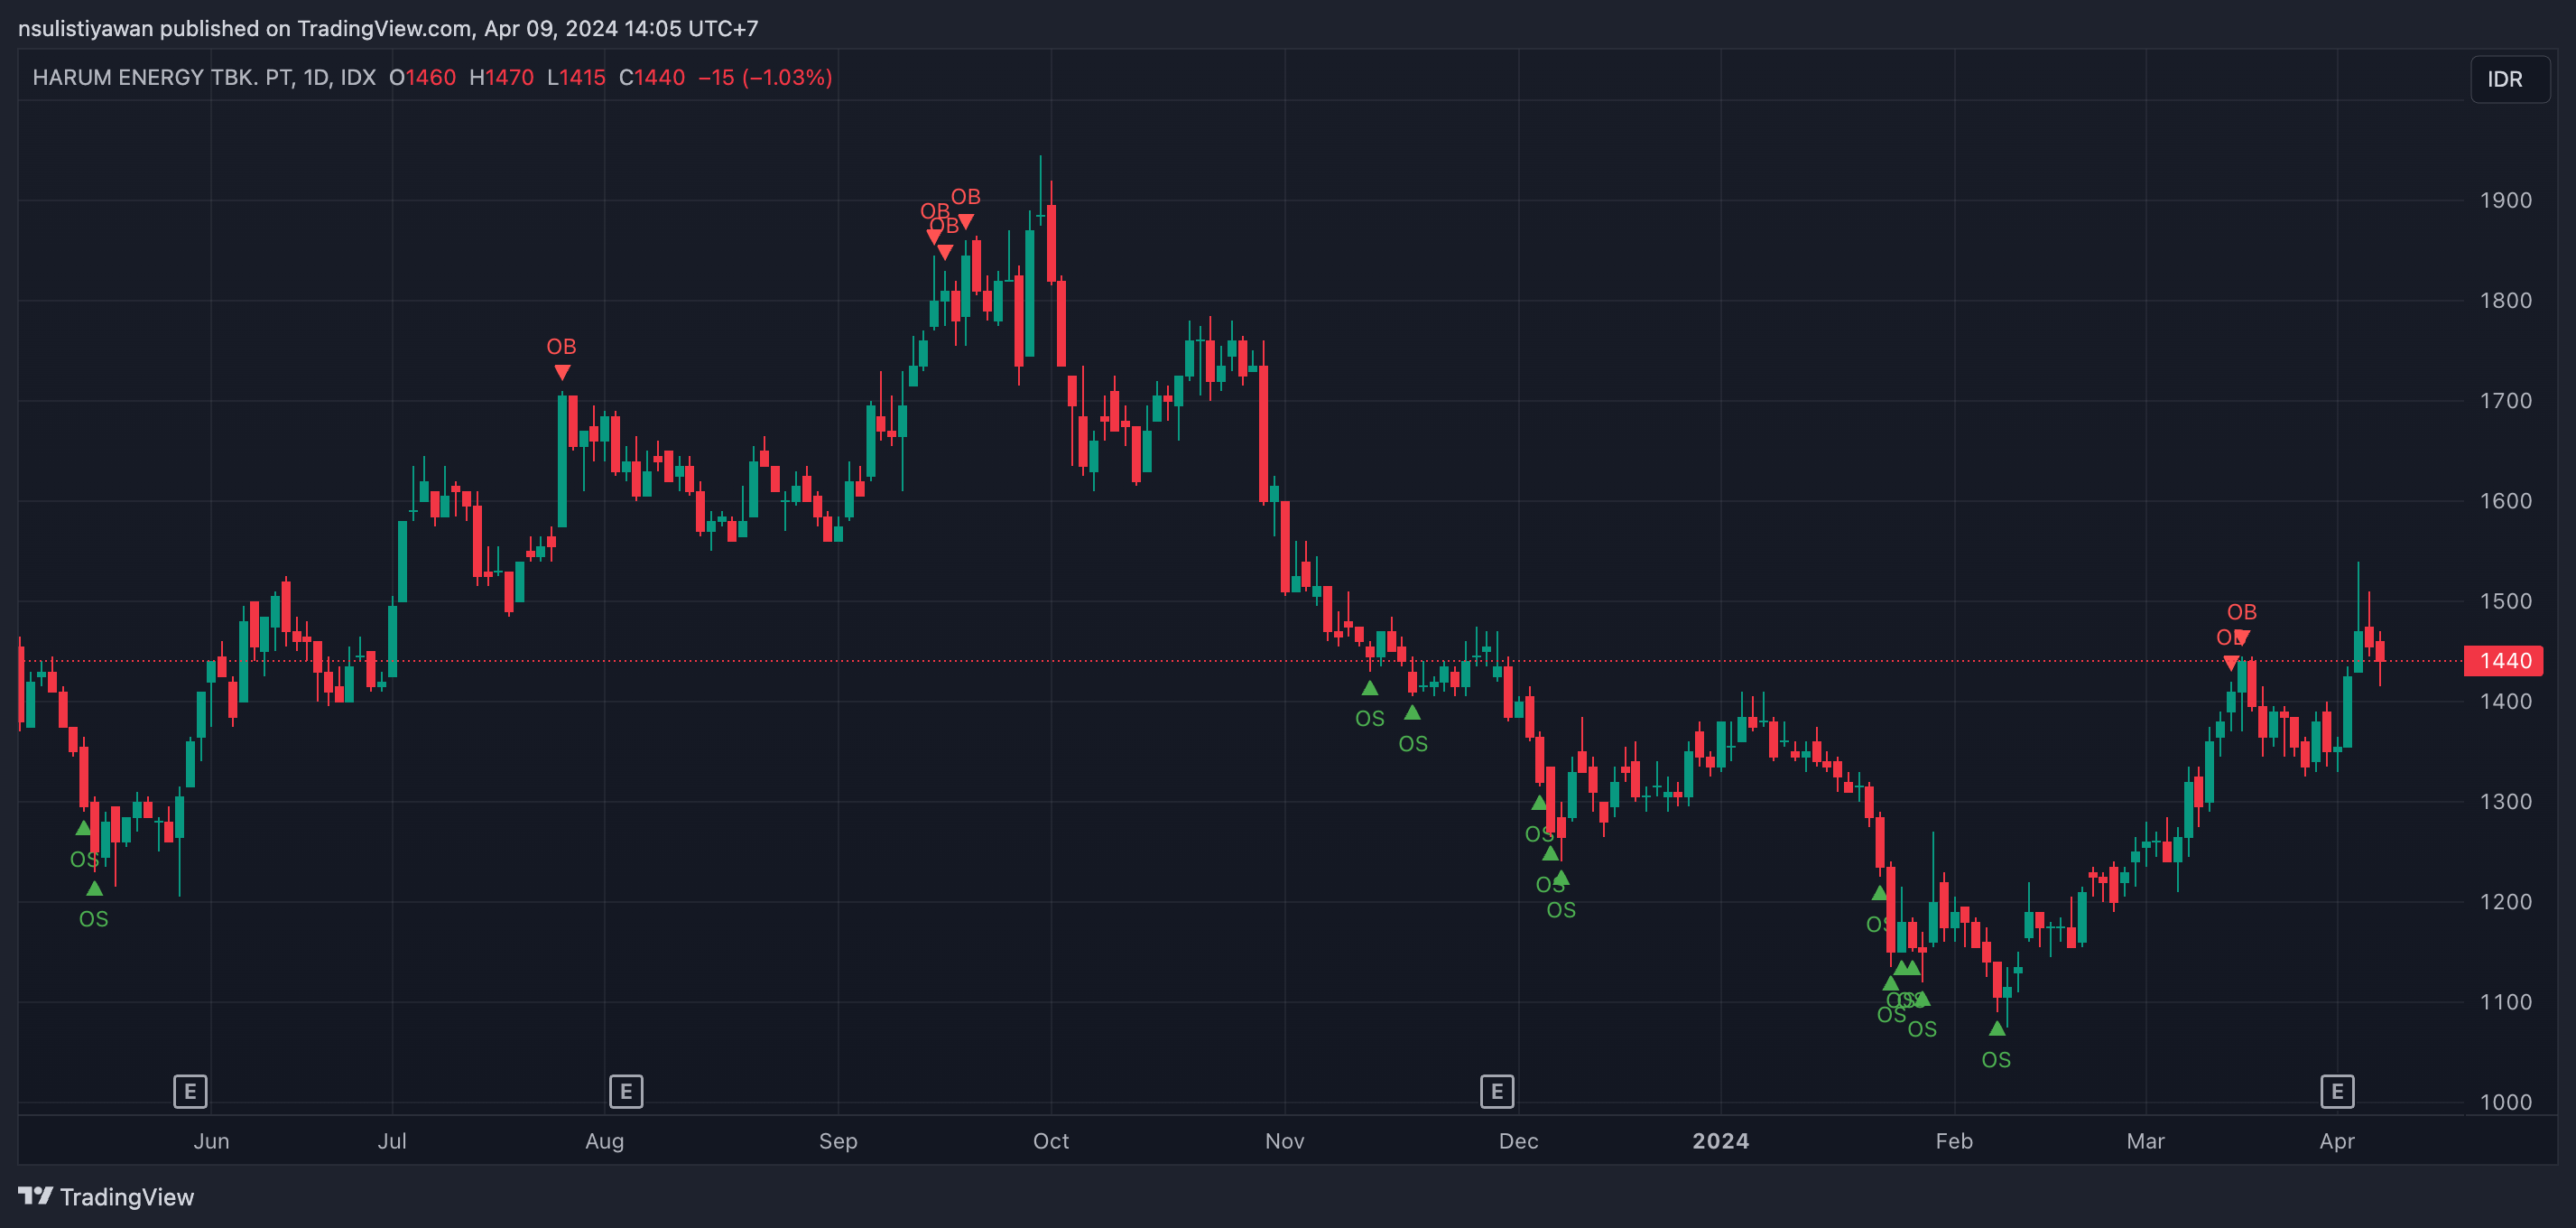
While the Relative Strength Index (RSI) is a powerful and widely used indicator in technical analysis, it's important to recognize that no single indicator can provide a comprehensive view of the market on its own.
Comments